
World War I THOR Data Analysis Project (Excel)
Analysis conducted using Microsoft Excel. The objective of this project was to demonstrate general proficiency of the software using a smaller dataset suitable for MS Excel. This project utilizes pivot tables, various types of charts, 3D mapping, filters, slicers and the occasional formula for data cleaning/aggregation (CONCAT, UPPER, TRIM etc).
This dataset was obtained from a World War I era THOR Report (Theatre History of Operations) provided by the United States Air Force. This report only contains aerial mission data from the United States, United Kingdom, Italy and France (NOT comprehensive). Given that this data is over a hundred years old, it should come as no surprise that there are an abundance of null fields in just about every column. For this reason, I've opted only to include fields that are not null, so bear in mind that the true numbers are likely to be much higher than reported here.
I've also provided slicers, which can be used to include blanks as well as filter out fields of your choosing. Enable Multi-Select by clicking on the 3-checkmark button next to each slicer's title. Pivot tables used to create these charts can be found in the downloadable Excel workbooks (hosted on OneDrive).
Kicking things off, we have a chart that provides a glimpse into the total number of aerial missions carried out by the Allies (included in the report).
We can see that Italy was an active participant in the conflict from the very beginning and that it was not until the final year of the campaign that the number of aerial missions drastically increased. Both the United States and the United Kingdom made significant efforts alongside Italy (and little from France) to close out the war in the fall of 1918.
Here we have the weight in bombs (monthly totals) dropped by each country. According to the most recently updated THOR Data Dictionary: "Weapon weight is based on the net explosive actually delivered to the target, irrespective of the weight of propellant it took to reach the target", meaning that if a "missile itself weighs 100 pounds, but delivers a 20 pound explosive warhead to the target, the weight used is 20 pounds."
As expected, this chart mirrors the previous one and also provides some insight into just how many Allied explosives were dropped during the conflict.
It appears that Italy flew more night missions while the United States tended to carry out more daytime operations.
Night operations carried out by Italy included fewer planes per mission, likely in an effort to avoid being spotted by anti-air defenses. The bulk of the missions carried out by the United States occurred in a short burst near the end of the war; highly visible operations during daytime likely necessitated the use of many planes per mission to overwhelm enemy anti-air forces.
The United Kingdom flew a roughly equal number of planes per attack across both day and night missions. It's possible that the UK airforce decided it would be best to fly with the same number of planes regardless of the situation.
Mapped Aerial Engagements Over The Course of The War
Experimenting with Excel's 3D mapping feature. This animation displays cumulative strikes at multiple locations over the course of WWI. I created an interactive mapping chart that included mission information for each location, but unfortunately, Excel doesn't allow exports of its 3D maps. :(
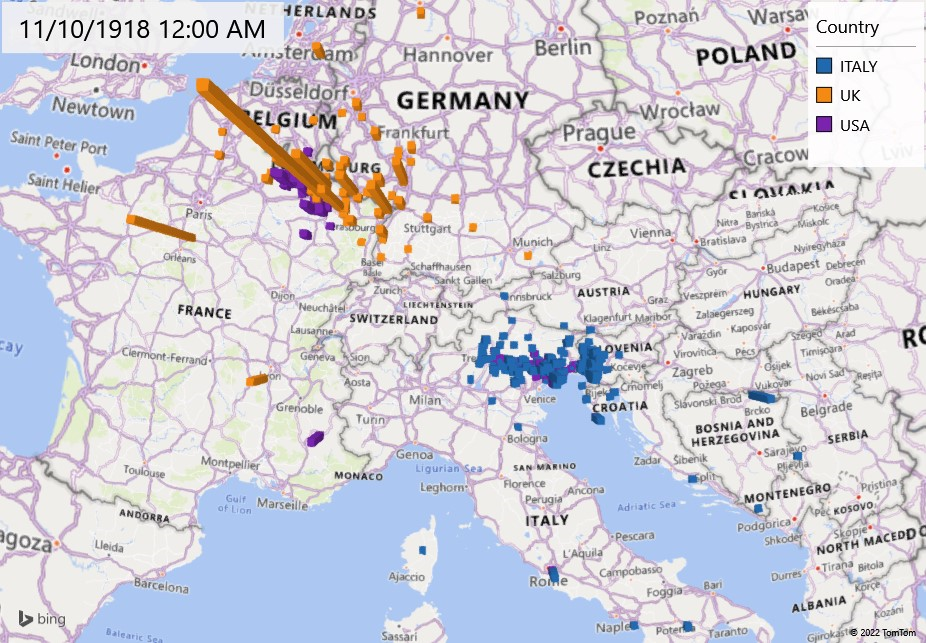
Still frame from the above animation.
Get In Touch
Feel free to shoot me a direct message through Email or LinkedIn. Looking forward to hearing from you!